used to show a centerline is
. A typical example of its use on a railroad diagram is seen in
figure 1.6.
1.5.
PROFILE
When looking at the surface of the rail from the side (a vertical projection), the ups and
downs are visible but the horizontal curves are not. A picture of a railroad from the side is
known as a profile; the ups and downs are referred to as grades. In this country, the steepness of
a grade is given in percent, arrived at by dividing the vertical rise by the horizontal length of the
grade and multiplying the result by 100.
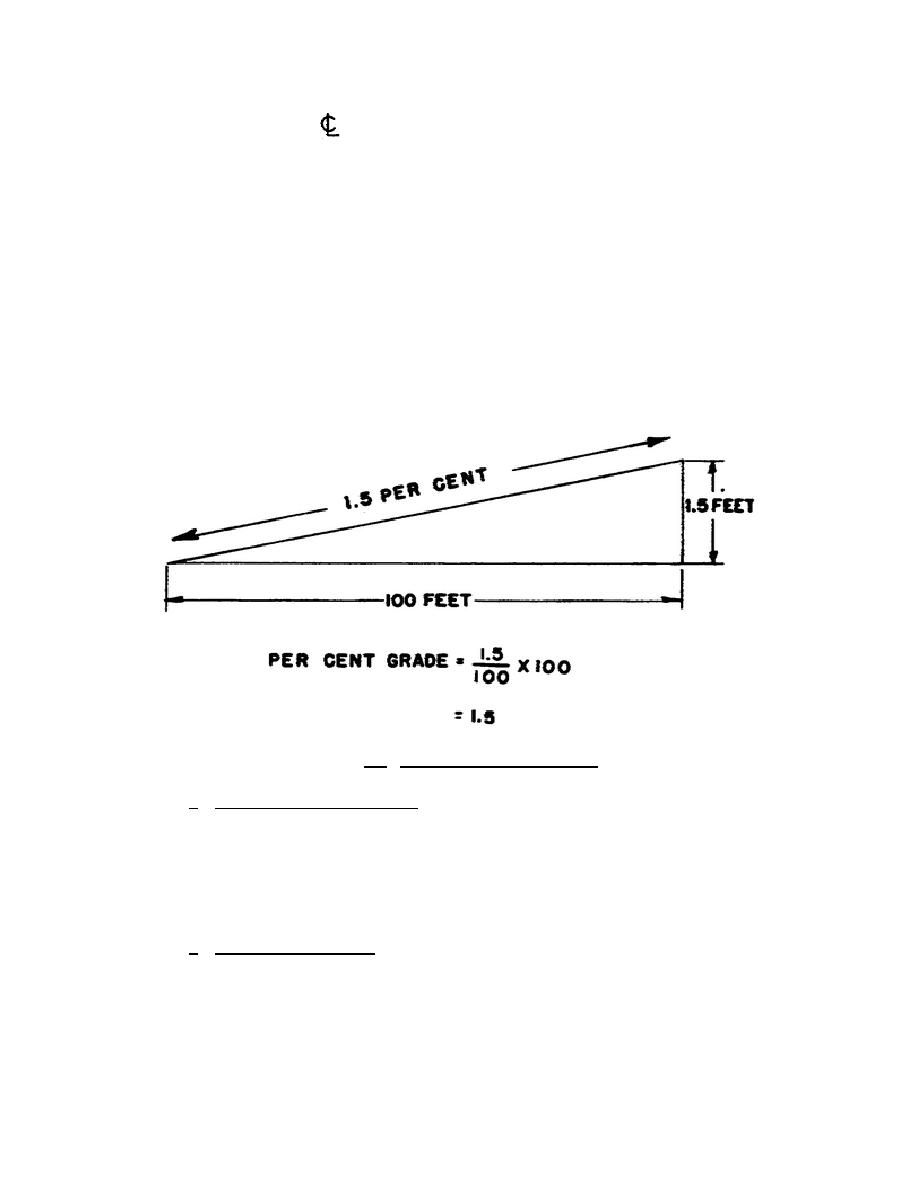
A simple way to determine percent grade is to find the rise in feet over a horizontal
distance of 100 feet. This gives you the percent grade. For instance, if a railroad rises 1.5 feet in
a horizontal distance of 100 feet, as shown in figure 1.4, the grade is 1.5 percent.
Figure 1.4. Determining Percent Grade.
a. Irregularities in the terrain make changes in the rate of grade on a rail line
necessary. However, abrupt changes are not permissible. You can readily imagine the result if a
speeding train came down a 2 percent grade and suddenly hit level tracks. The impact of the
front wheels hitting the level tracks would damage both the locomotive and the tracks.
Furthermore, if the change were great enough, the center section of the locomotive would be
lifted off the track and be derailed.
b. Using a vertical curve wherever different gradients meet solves the problem. The
angle formed where the grades meet must
10


 Previous Page
